Skills Priority List
Jobs and Skills Australia (JSA) has responsibility for regularly reviewing the national skills needs of Australia and producing a Skills Priority List (SPL).
The SPL provides a current labour market rating and a future demand rating for occupations nationally, with ratings also available at the state and territory level. This list provides the backbone piece of labour market analysis on occupations that will be a key input to a range of Australian Government policy initiatives, including targeting of skilled migration, apprenticeship incentives and training funding.
The SPL, methodology paper and supplementary reports are all available on the NSC website.
JSA welcomes input on the SPL year-round as part of our continual review process. Further information can be found by contacting skillsprioritylist@jobsandskills.gov.au
Summary
The 2021 SPL covers nearly 800 occupations nationally. Occupations that are considered to be in scope for the SPL are defined in the Australian and New Zealand Standard Classification of Occupations (ANZSCO) as Skill Level 1 - 4 occupations at the six-digit level, excluding occupations ‘not further defined’ or ‘not elsewhere classified’.
The evidence supporting the development of this list (the SPL) includes labour market data analysis, employer surveys, stakeholder consultation with industry bodies and federal and state/territory government agencies, as well as consideration of other available sources of data and information.
Key findings
Shortages have been identified in 153 occupations (19% of assessed occupations) nationally.
Shortages are most common in the Technicians and Trades Workers occupation group, with 42% of occupations assessed in shortage.
- Large employing Technicians and Trades worker occupations in shortage include Electrician (General), Carpenter, Chef and Fitter (General).
- Previous research conducted by the JSA has found that shortages of Technician and Trades workers are often persistent over time.
Close to a fifth (19%) of assessed Professionals occupations are in shortage, followed by Machinery Operators and Drivers (17%), Managers (12%) and Community and Personal Service Workers (8%).
Skill Level 3 occupations have the largest proportion in shortage (38%), followed by Skill Level 1 (19%), with the fewest occupations in shortage for Skill Level 4 and Skill Level 2 (9% and 7% respectively).
- Large employing Skill Level 3 occupations in shortage include Hairdresser, Child Care Worker and Motor Mechanic (General).
Proportion of occupations in shortage, by Major Occupation Group and Skill Level
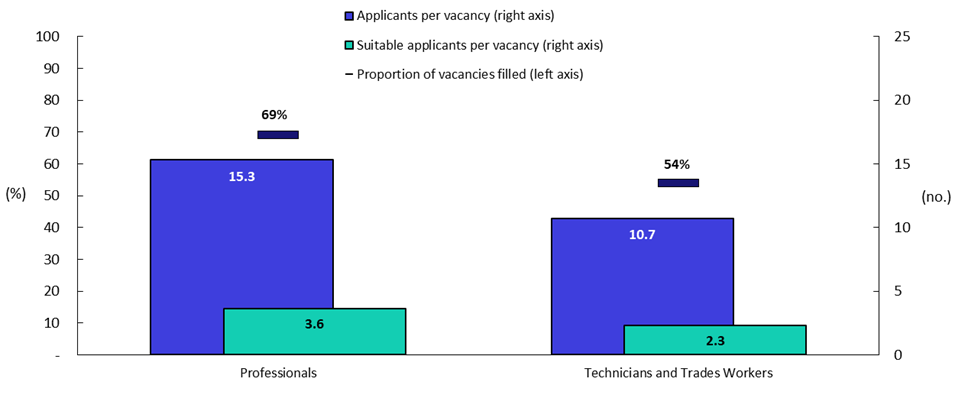
Of the two occupation groups with the highest proportion of occupations in shortage, Professionals and Technicians and Trades Workers, Jdata show that in 2020-21, employers recruiting for Technicians and Trades Workers attracted smaller fields of applicants and filled a lower proportion of their vacancies.
Proportion of vacancies filled (%), average number of applicants and suitable applicants per vacancy (no.), 2020-21
Future demand
265 occupations have strong projected future demand (33% of assessed occupations), 481 have moderate future demand (60%), and 53 have soft future demand (7%).
- Strong future demand is most common in Labourers (50% of assessed occupations), Community and Personal Service Workers (44%), and Professionals (43%). Large employing occupations in these groups include Child Care Worker and Developer Programmer.
- Strong future demand is also most common in higher skilled occupations (43% of Skill Level 1 occupations and 31% of Skill Level 2 occupations).
57 occupations (7% of assessed occupations) have strong projected future demand and are currently in shortage nationally.
- This includes occupations such as ICT Project Manager and Aged or Disabled Carer.
Results by state and territory
Of the states and territories, the Northern Territory has the highest proportion of assessed occupations in shortage (32%), followed by New South Wales (30%).
The Australian Capital Territory has the lowest proportion of assessed occupations in shortage (16%).
While there were 646 occupations assessed as not in shortage nationally, some were in shortage in a number of states and territories.
It should be noted that the variation across the states and territories, at least in part, reflects differences in the stakeholder input received.
Number of occupations assessed as being in shortage by state and territory
|
State/Territory |
Occupations in shortage |
Proportion of all assessed occupations in shortage (%) |
|||
|
Whole of jurisdiction |
Metropolitan only |
Regional only |
Total |
||
|
New South Wales |
226 |
0 |
17 |
243 |
30% |
|
Victoria |
147 |
1 |
17 |
165 |
21% |
|
Queensland |
127 |
0 |
18 |
145 |
18% |
|
South Australia |
132 |
0 |
17 |
149 |
19% |
|
Western Australia |
130 |
0 |
19 |
149 |
19% |
|
Tasmania |
132 |
0 |
17 |
149 |
19% |
|
Northern Territory |
252 |
0 |
5 |
257 |
32% |
|
Australian Capital Territory |
129 |
0 |
0* |
129 |
16% |
|
Australia |
136 |
0 |
17 |
153 |
19% |
*All of the Australian Capital Territory is considered metropolitan.
Additionally, JSA data show regional employers generally attract fewer applicants than those in metropolitan locations, and fill fewer vacancies (57% of vacancies filled in regional areas compared with 63% in metropolitan areas).
Resources
The SPL and related documents are available on the NSC website. This includes the Skills Priority List Methodology, frequently asked questions, summary reports and supplementary information.